
Original research · Arrests & Enforcement
The Geography of Texas Marijuana Arrest Records
The short answer
Texas’s selected marijuana-coded records rose 5.4% between 2023 and 2025 in one DPS workbook, but the statewide increase hid opposite county trends. In 2024, Harris County added 1,370 records while the other 249 matched counties lost 1,129. In the next year, Harris declined while the other counties increased.
On this page 8 sections
The statewide total hides different local directions
A statewide total answers how many selected records appear in the file. It does not tell readers whether the same change occurred across Texas. The DPS county/offense workbook lets us separate that total into county contributions without guessing why those contributions changed.
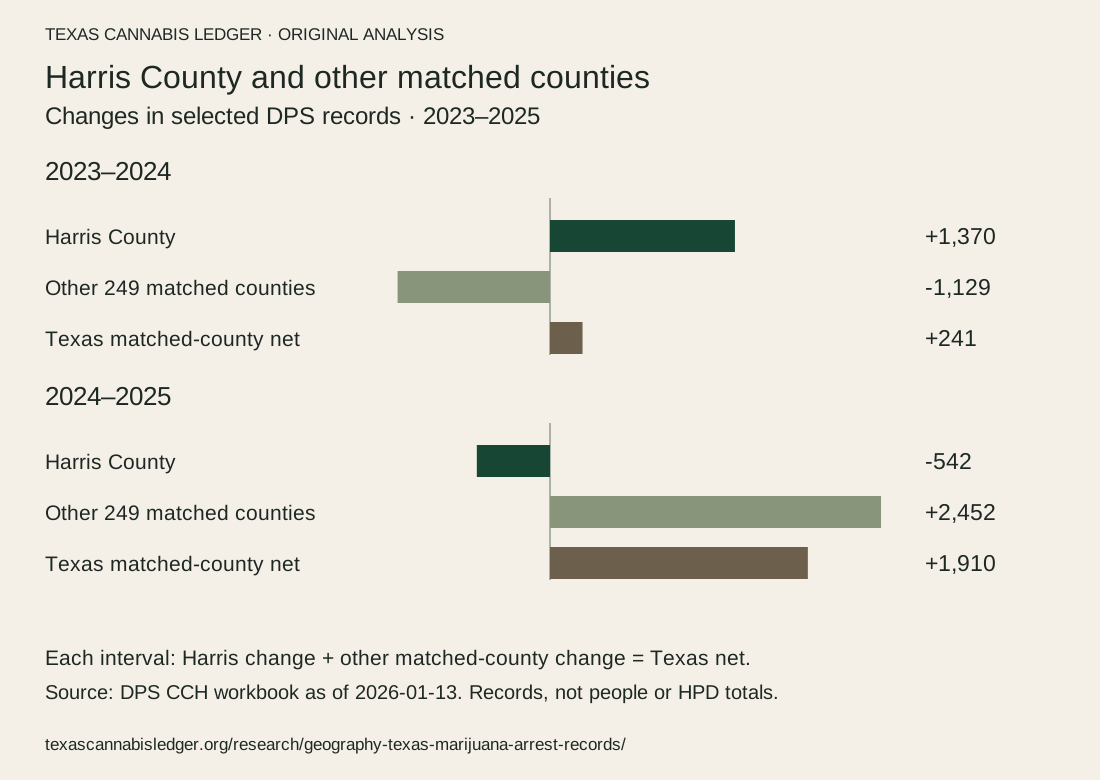
| Arrest-year interval | Harris change | Other 249 change | Texas net |
|---|---|---|---|
| 2023–2024 | +1,370 | -1,129 | +241 |
| 2024–2025 | -542 | +2,452 | +1,910 |
Between 2023 and 2024, Harris County’s increase was larger than the net statewide increase. Subtract Harris’s contribution and the remaining matched counties, taken together, declined. Between 2024 and 2025 the directions reversed: Harris’s decline offset part of an increase elsewhere.
These are differences in source counts, not movements of individual cases between counties. Harris County totals also do not isolate the Houston Police Department. A city’s policy cannot be credited or blamed from this decomposition.
For journalists: the table and graphic use the broader selected marijuana-coded series. TCL’s Harris County possession investigation uses two narrower base-possession categories. Its Harris totals are different because its question and selection are different. Cite the definition with the number.
More records, but a smaller change after accounting for population
The selected total increased from 39,550 in 2023 to 41,701 in 2025. The resident-normalized record rate increased less: 2.1%, compared with the 5.4% increase in counts. In 2024 the count rose while the calculated rate fell.
| Arrest year | Selected records | Matched-county residents | Records per 100,000 |
|---|---|---|---|
| 2023 | 39,550 | 30,715,122 | 128.8 |
| 2024 | 39,791 | 31,314,529 | 127.1 |
| 2025 | 41,701 | 31,705,829 | 131.5 |
For each year, the rate is selected records ÷ population of the 250 matched counties × 100,000. Population comes from the same-year estimates in Census Vintage 2025. It is not a count of people exposed to police encounters, and the records can involve nonresidents. This rate is not an individual resident’s probability of arrest.
A count and a rate answer different questions. Neither, by itself, identifies a change in police priorities, marijuana use, reporting completeness or charging decisions.
Where the 2025 increase and decreases appear
Of the same 250 matched counties, 135 increased between 2024 and 2025, 101 decreased and 14 were unchanged. Increasing counties added 4,612 records, while declining counties lost 2,702, leaving a net increase of 1,910.
The table shows the five largest increases and five largest decreases by absolute record change. It is not a rate ranking or a list of the most statistically unusual counties. The download includes every matched county so the selected examples can be checked against the full distribution.
| County | 2024 records | 2025 records | Record change |
|---|---|---|---|
| Tarrant | 3,254 | 3,803 | +549 |
| Dallas | 2,675 | 2,945 | +270 |
| Waller | 157 | 393 | +236 |
| Bexar | 988 | 1,205 | +217 |
| El Paso | 737 | 921 | +184 |
| Harris | 2,095 | 1,553 | -542 |
| Hidalgo | 1,917 | 1,669 | -248 |
| Lubbock | 845 | 726 | -119 |
| Montgomery | 1,568 | 1,458 | -110 |
| Grayson | 364 | 267 | -97 |
Large counties can contribute a large share of a statewide change even when their percentage change is modest. Conversely, a small initial count can produce a large percentage change. Neither is a reason to infer a policy effect without additional evidence.
What the 16-county concentration finding does—and does not—show
The 16 highest-count counties account for 20,922 of 41,701 selected 2025 records, or 50.2%. That finding is already published on the statewide arrests page and in TCL research release v0.1.0.
Those same counties contain 18,665,917 of the estimated 31,709,821 Texas residents in Census Vintage 2025: 58.9%. The record-share denominator covers selected matching records; the population-share denominator here covers all 254 Texas counties. The statewide rate table above instead uses only the 250 matched counties’ populations.
Concentration by count alone is not evidence of disproportionately intense enforcement. These population figures do not establish individual exposure either: resident counts and administrative records are different measures. The defensible finding is where the selected records are assigned, not where a person is most likely to be arrested.
What exactly was counted?
TCL selects DPS county/offense rows whose offense or statute text contains MARIJ or MARIHUANA, then sums the adult and juvenile count columns for each arrest year. The selection retains mixed CS/MARIJ classifications. It is broader than marijuana possession alone and does not capture every possible THC-related classification.
DPS describes these as criminal-history statistics, with arrests assigned by reported arrest date. TCL’s measure is the selected aggregate record count. The workbook does not establish a count of unique people, distinct arrest events, prosecutions, convictions or all police encounters.
As a definition check, the two exact base-possession codes, 35620008 and 35620009, rise from 34,383 in 2023 to 37,298 in 2025, an 8.5% increase. That is a different, narrower series—not an alternative label for the 41,701-record total. The report’s downloadable inputs preserve both selections.
Missing rows are not zero arrests
Jeff Davis, Loving, Motley and Stonewall have no matching selected row in this extract. Their counts remain blank and their populations are excluded from the matched-county rate. Seven other counties have matching rows with observed zero counts for 2025. These are different states.
All 254 counties appear somewhere in the complete all-offense workbook. The absence of a selected marijuana-coded row does not prove a county failed to report, had no marijuana enforcement, or had zero arrests. Likewise, 250 matching counties is not a measure of annual police-agency reporting completeness.
What remains unanswered
The observed differences could involve enforcement activity, submissions, classification, corrections or several factors together. These workbooks do not separate those explanations. They also cannot establish whether a local policy caused a change, whether cases were filed or dismissed, or whether an allegation led to a conviction.
This report uses one January 2026 extract for all three years. It does not splice historical releases into a supposedly harmonized long-run series. Our companion DPS workbook comparison shows why the same arrest year can have different selected counts in different source versions.
For legal rules, use the Texas marijuana-law guide. A county’s historical records do not establish what is legal there.
Data, method and reuse
Download the complete calculation bundle · ZIP · Source identities and definitions · JSON
Statewide annual table · CSV · All matched-county changes · CSV · Harris decomposition · CSV
The calculation bundle contains 762 county-year status rows: all 254 counties for each of 2023, 2024 and 2025. Missing numeric values remain blank. It also contains statewide summaries, all matched-county changes, the Harris decomposition, source hashes and a portable reproduction script. Run python3 -I reproduce.py after extracting it.
The method is: apply the stated source-row selection; aggregate county/year counts; join the same-year Census resident estimate; exclude missing selected rows from rate denominators; calculate differences and rates; sort county changes without a population filter. The 16-county result uses the shortest descending-count prefix that reaches at least half the total. County names break ties.
The package reproduces arithmetic from normalized inputs. It does not reconstruct the original workbook extraction. The source-to-input checks performed for this report are documented separately in the review materials; neither those checks nor reproducible code establishes complete agency reporting or independent human review.
Release boundary: public v0.1.0 contains the 16-county concentration finding and the separate hemp finding. It does not contain this report’s new rate, county-change or decomposition analyses. The website calculation bundle is not represented as an additional public GitHub release.
Suggested attribution: Texas Cannabis Ledger, “The Geography of Texas Marijuana Arrest Records,” 2023–2025 arrest years, DPS workbook as of January 13, 2026; population: Census Vintage 2025. Identify the particular table and selection used, and link the report and original sources. TCL performed the calculations; the agencies supplied the underlying records.