
Two counties. A clearer picture.
Compare reported marijuana arrests and hemp-location records side by side. Start with your county, then choose another.
Choose two counties to compare their public records.
Compare the population-adjusted rate.
Select two counties to see a factual comparison.
Marijuana arrest records
Calendar year 2025 · DPS CCH / Census population estimates
| Measure | Your county | Comparison county |
|---|---|---|
| Records per 100,000 residents | — | — |
| Total reported records | — | — |
| Possession-coded records | — | — |
| Other marijuana-coded records | — | — |
| Change in records from previous year | — | — |
| County population estimate | — | — |
Records are not necessarily unique people or arrest events. Rates use resident population and may include nonresidents. A missing source row is unavailable, never zero. Year-over-year change requires both years and a positive prior count.
Compare all three arrest years
| Measure | Your county | Comparison county |
|---|---|---|
| 2023 | — | — |
| 2024 | — | — |
| 2025 | — | — |
Hemp-location records
DSHS snapshot · 2026-10-19 · independent of the arrest-year selector
| Measure | Your county | Comparison county |
|---|---|---|
| Retail registration location records | — | — |
| Product-license location records | — | — |
These categories do not establish unique businesses, open stores or medical dispensing locations. Zero qualifying matches describe this source snapshot only.
Explore the evidence.
Same measures. Separate sources.
Arrest figures use the DPS marijuana-coded county series and the matching Census annual population estimate. Hemp figures use the separately dated DSHS current-status physical-location extract. Neither dataset establishes how individual cases move through court. The DPS workbook was dated January 13, 2026; the hemp source snapshot is dated 2026-10-19.
Original DPS workbook · Census population estimates · DSHS counting rules and sources · Methodology
Find and sort all 254 counties · Choose a county on the Texas map · Download the complete arrest CSV
How to read a county comparison
How are Texas county marijuana arrest rates compared?
For each calendar year, divide reported marijuana-coded DPS arrest records by the matching Census county population estimate, then multiply by 100,000. The Ledger displays rates to one decimal place. Rates can include nonresidents and do not measure individual arrest risk.
Does a missing county record mean zero arrests?
No. A county without a matching source row is unavailable. A reported zero remains zero. Counties below 10,000 residents retain a small-population warning and are excluded from TCL’s rate ranking.
Do hemp totals describe the selected arrest year?
No. Retail registrations and product licenses are separate physical-location record categories from the dated DSHS snapshot. Changing the arrest year does not change that snapshot, and zero matches do not establish no hemp activity.
All 254 counties: latest source figures
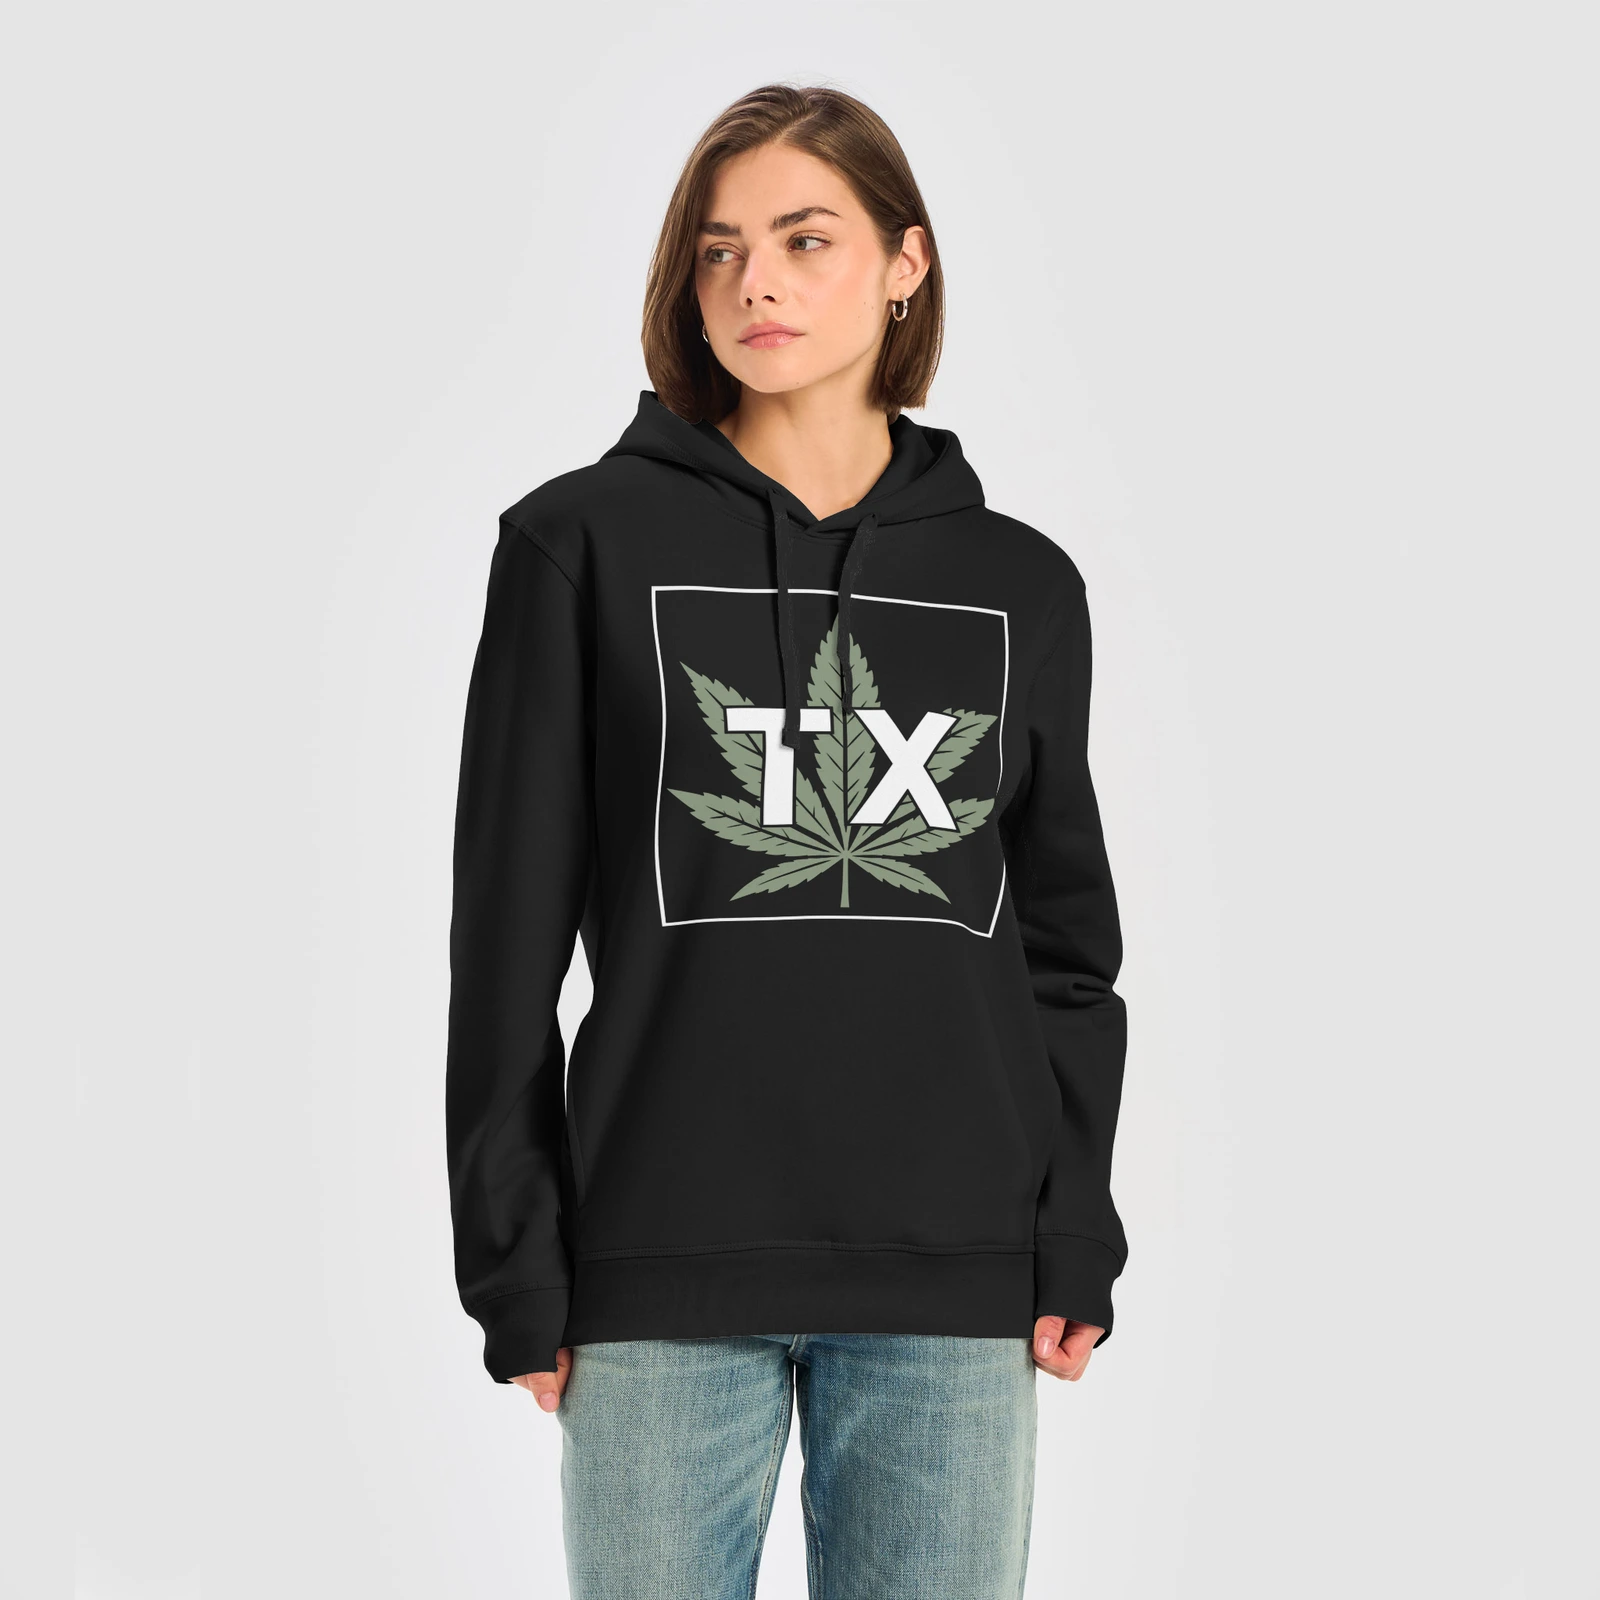
Wear your support. Keep the Ledger open.
A sticker, a hoodie, or a coffee helps fund the source checks and upkeep behind free Texas cannabis records. Choose how you want to support the work.
Support sustains the project. It never changes what the records show.